
Introduction: The Robotaxi Race Is About More Than Great Tech
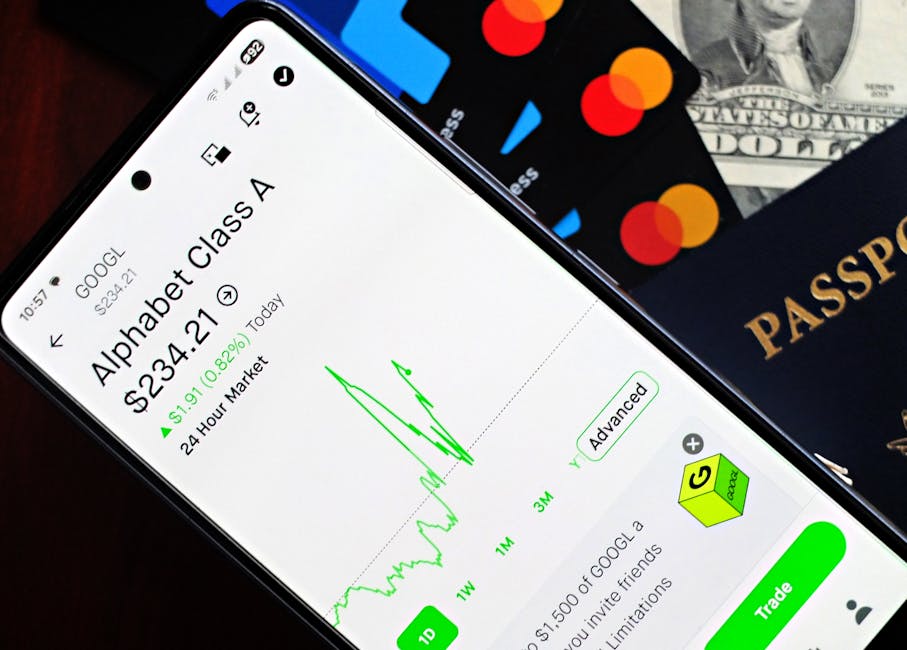
Investors have been cheered by high-profile tests and eye-popping demonstrations from the biggest players in autonomous driving. Waymo, a core Alphabet unit, has built a reputation for safety-first testing with LiDAR, cameras, and radar. Tesla, by contrast, leans on computer vision with a camera-first system and a rapid rollout mindset. Beyond the flashy demonstrations, the robotaxi race is really a competition over who can run more rides more safely and more cheaply over time. In this arena, one underrated lever could tilt the odds in favor of the winner: the effective use of every vehicle in the fleet. This underrated factor could ultimately determine profitability, speed to scale, and even whether a company becomes the long-term market leader.
What Most Investors Overlook in the Robotaxi Narrative
Media coverage tends to celebrate the latest sensor, the boldest demonstration, or the most aggressive expansion plan. While those elements matter, the real economics hinge on how effectively a fleet is utilized. A vehicle that sits idle for a large portion of the day is a sunk cost that drags down every per-mile metric, from maintenance to insurance to depreciation. Conversely, a tightly run, intensively utilized fleet can generate more rides, better yields, and faster payback on capital, even if the per-vehicle cost is higher in the short run.
- Hardware vs software tradeoffs: LiDAR-heavy designs may be pricier per unit but can offer safety and redundancy that unlocks more driving hours in complex urban environments. A vision-first approach can cut upfront costs but may require more data and software optimization to achieve similar utilization in dense cities.
- Cost of capital: Per-vehicle capex matters, but so does how quickly a fleet can pay for itself through rides. Higher upfront costs can still be worthwhile if utilization and pricing power deliver strong cash flow.
- Regulatory tempo: Faster approvals to test and operate in new markets translate into more utilization opportunities, all else equal. Slower progress here pins operators to the same geographies with limited upside.
This underrated factor could reshape margins: utilization as the hidden engine
Utilization is more than just how many hours a car spends on the road. It’s the rhythm of a business model. In robotaxis, capital is tied up in vehicles, software platforms, and safety systems. The more you squeeze usable hours from each asset, the faster you spread fixed costs over revenue-generating activity. If two operators start with similar fleets, the one with higher effective utilization generally posts stronger margins within the same market, all else equal. This is the kind of operational leverage that investors should monitor closely.

- Case in point: In dense urban cores, an optimally planned mix of peak-hour service, airport corridors, and in-city fixed routes can push daily utilization per vehicle from 8–10 hours to 12–14 hours. That 20–40% improvement can dramatically lift revenue per vehicle per day, assuming ride demand stays robust.
- Implication for capex: If utilization improves, the required fleet size to achieve target ride counts falls, lowering total capital needs and accelerating the path to profitability.
- Pricing power: High-utilization fleets can command better per-ride economics through dynamic pricing during peak periods, reducing the need to chase volume with discounting.
Think of utilization as the battery behind the robotaxi lamp. It’s the resource that makes every other investment shine. If this underrated factor could be the predictor of EBITDA margins in a market where the cost of technology is high and consumer demand is variable, then it deserves a central place in any investing thesis.
Utilization metrics to watch
- Hours per vehicle per day (HPVD) – target ranges often 8–12 hours in early markets; aim for 12–16 as cities mature.
- Miles per vehicle per day – healthy benchmarks can be 40–120 miles, depending on city density and service design.
- Rides per vehicle per day – higher is better, with a focus on the mix of short and longer trips to optimize trip-end revenue and battery life.
- Average ride length – this affects battery usage, charging cycles, and vehicle wear; a balanced portfolio avoids over-reliance on ultra-short trips.
Regulatory tempo: speed to rollout can be a bigger moat than you think
Regulation is a powerful, invisible force shaping robotaxi economics. In markets where local authorities move quickly to allow operations, pilots can become revenue-generating services sooner, expanding utilization without the need for massive fleet expansions. Conversely, slow or fragmented approvals create a drag on the same utilization engine investors want to optimize.
Consider two hypothetical operators: Operator A receives rapid permits in multiple cities, enabling rolling pilots and measured expansion. Operator B faces a patchwork of approvals, requiring bespoke safety cases and longer testing cycles. Even if Operator B has a superior hardware stack, Operator A’s fleet can reach equal or greater ride volumes faster, compounding revenue and improving unit economics.
Data networks, software, and the network effects of scale
Autonomy isn’t only about sensor accuracy; it’s about software, data, and the ability to learn from more miles driven. A larger, more diverse data set helps optimize routing, safety responses, and maintenance scheduling. That means a bigger fleet in more places can learn faster, improving performance more quickly than a smaller fleet in fewer markets. This is the essence of software-driven moat in the robotaxi race.

Two key dimensions matter here:
- Route optimization and demand forecasting: A platform with more trips yields better demand signals, enabling precise pricing and better driverless routing choices, which translates into higher utilization and more rides per hour.
- Safety margins and risk management: With more miles, the system learns to anticipate edge cases, reducing incident risk and insurance costs, which flow into lower operating costs per mile.
In networks where software updates roll out in stages, the lag between a successful update and its impact on utilization can be the difference between a steady, predictable business and an unpredictable one. Investors should monitor how each company tests, validates, and deploys software improvements and how those changes translate into real-world miles and rides.
How to build a practical investment thesis around this underrated factor could
If you’re evaluating robotaxi plays, here’s a practical framework to incorporate this underrated factor could into your model. It blends quantitative checks with qualitative signals so you can separate hype from durable economics.
- Quantify utilization potential: Build a simple calculator using city density, expected rides per day, and target HPVD. Compare two operators in the same market to see who achieves higher revenue per vehicle per day.
- Assess fleet mix and asset utilization: Determine how many hours are spent charging versus driving. A fleet with fast-charging hardware and efficient charging management can keep more wheels turning.
- Evaluate regulatory pathways: Look for cities with clear pilot programs and predictable timelines. The faster the approvals, the sooner utilization climbs.
- Analyze unit economics: Compute cash flow per mile after maintenance, insurance, and depreciation. The ratio of utilization-driven revenue to these costs is critical.
- Examine data advantages: Consider the value of data networks and software moats. A larger, more mature data loop can improve every other metric over time.
In short, this underrated factor could be the axis around which the investing thesis rotates. It’s not just about how many cars you have, but how quickly and efficiently you can turn those cars into reliable rides that customers want to take day after day.
Real-world scenarios: what investors can watch in the near term
Scenario A: A company with a modest fleet but aggressive utilization optimization shows improving margins quarter after quarter. The fleet is tuned for peak demand, with dynamic pricing that captures more revenue during busy hours. In a few markets, the company expands to new neighborhoods just as regulatory timelines shorten, accelerating utilization growth without a proportional capex spike.

Scenario B: A competitor with a larger fleet but slower expansion faces regulatory delays and a challenging charging topology that keeps vehicles idle for longer periods. Even though the per-vehicle cost is lower, the overall utilization remains muted, preventing a meaningful leap in margins or free cash flow.
In these scenarios, the first company demonstrates how this underrated factor could shift economics in favor of higher utilization, even when credited with slightly higher upfront costs. It’s a reminder that capital efficiency and execution can outpace sheer scale in the early days of robotaxi markets.
A practical investor checklist to judge this underrated factor could
- Does the operator publish clear utilization metrics (HPVD, miles per vehicle per day, rides per day)?
- Is there a credible plan to improve charging, maintenance, and dispatch to raise utilization?
- Are regulatory milestones accelerating in the markets the company serves?
- Does the company have data advantages from scale that could compound utilization gains?
- What’s the sensitivity of margins to utilization changes in the company’s long-term plan?
Frequently asked questions (FAQ)
What does utilization really mean for robotaxi profitability?
Utilization measures how effectively a vehicle earns revenue. Higher hours on the road, more rides per day, and efficient charging translate into lower per-mile costs and higher gross margins. In simple terms, utilization is the engine that turns a fleet into a money-making asset.
Why is regulatory speed so pivotal for investors?
Regulatory tempo determines how quickly a company can test, deploy, and scale in new markets. Faster approvals mean more miles driven, more data, and better learning, which often leads to quicker break-even and cash flows. Slow rollouts, by contrast, cap potential utilization and extend payback periods.
Can software actually beat hardware in the robotaxi race?
While hardware quality matters, software and data networks can unlock superior utilization. Better routing, demand forecasting, and safety algorithms allow a fleet to perform more rides with the same assets, improving unit economics as the company grows.
How should a retail investor approach this topic?
Focus on utilization-related metrics in public filings, earnings calls, and investor decks. Compare how different operators plan to boost hours, rides, and charging efficiency. Use scenario analysis to test how sensitive margins are to utilization shifts.
Conclusion: The careful investor will watch the lever nobody else talks about
In the robotaxi race, many bets rely on the same handful of headline advantages: sensor depth, software sophistication, or fleet size. Yet the long-run winners are likely to be the operators who optimize utilization to the max, while navigating regulatory, data, and cost hurdles with discipline. This underrated factor could be the unseen driver that makes profitability feasible at scale faster than investors expect. By focusing on utilization, regulatory cadence, and data-driven software moats, investors can craft a more robust thesis that stands up to the volatility inherent in early-stage tech bets.
Final takeaway
The robotaxi market is still in its early innings, and the path to sustainable profits is rarely a straight line. This underrated factor could be the best predictor of who wins first and who wins big. By centering your investment research on utilization, regulatory momentum, and data-enabled software advantages, you tilt the odds toward operators with the strongest, most repeatable cash flows over time.

Discussion