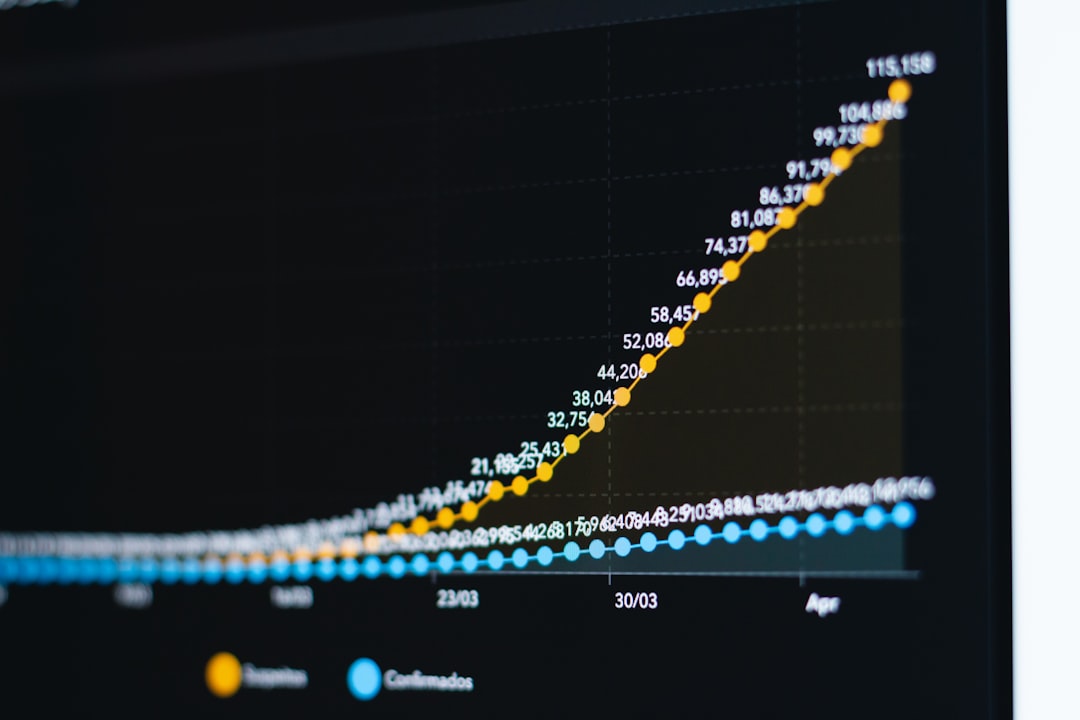
Gas prices have moved higher in March 2026 as global oil markets navigate renewed tensions in the Middle East and questions about supply resilience. Drivers are feeling the impact at the pump, where the price per gallon sits above year-ago levels. A newly published chart shows what you're paying for at the pump, breaking down the price into five key components.
Why a single gallon costs so much
Oil markets have grown more volatile as geopolitical risk and supply concerns ripple through futures prices. Traders watch crude benchmarks closely, and when risk perception rises, wholesale costs tend to creep higher. The result is a quicker lift in pump prices than in many other consumer goods, even as domestic demand stays relatively steady.
The chart shows what you're paying for at the pump
This chart shows what you're paying for at the pump, broken into five primary components: crude oil, refining costs, distribution and marketing, taxes, and the retailer margin. The breakdown helps explain why prices vary from station to station and why a national average can mask sharp regional swings.
What drives each piece of the price
Crude oil costs typically represent the largest share of the pump price. When Brent or WTI futures move, wholesale gasoline follows, often with a short lag. In rough terms, the price of crude sets the stage for what you pay at the rack, while refining and other costs layer on top. The chart shows what you're paying for at the pump becomes a reflection of global oil markets as much as it does local taxes or station fees.
Refining costs and margins add a middle layer to the price, influenced by input costs, maintenance, and seasonal demand for gasoline blends. Distribution and marketing fees cover transport, storage, and the costs of delivering gasoline to retailers. Taxes vary widely by state and locale, sometimes surpassing other components during periods of high prices. Finally, the retailer margin captures profit per gallon after expenses.
Putting the numbers in context
As of early March 2026, a typical national snapshot shows gasoline at the pump hovering near the $4 per gallon mark in many states, up roughly from a year earlier. Oil markets have pushed Brent crude around the $80 per barrel area, with traders citing geopolitical risk and supply concerns as primary catalysts. By breaking down the price, the chart shows what you're paying for at the pump in tangible terms, rather than a single sticker price without context.
A closer look at the component parts
- Crude oil costs: roughly 60-65% of the pump price, driven by global supply, sanctions, and regional risk premiums.
- Refining costs and margins: about 15-20% of the price, influenced by input costs, maintenance, and seasonal blending requirements.
- Distribution and marketing: around 5-10%, covering transportation, storage, and logistics to get gas from refinery to station.
- Taxes: typically 15-25% in many states, with variability based on state and local levies.
- Retailer margin: about 3-7% or a few cents per gallon, reflecting competition and store economics.
What the market means for households
For everyday drivers, the takeaway is simple: when crude costs rise or geopolitical risk spikes, the chart shows what you're paying for at the pump moves higher. That linkage can be direct and fast, even as individual household budgets vary by state, commute, and driving patterns. Energy analysts say the inverse is also true—when crude prices retreat, pump prices often ease, sometimes faster than any single tax or fixed cost would suggest.
“The Iran-related tensions and broader regional risk are feeding into crude forecasts and, in turn, pump prices,” says Maya Chen, senior energy analyst at MarketFocus. “The chart shows what you're paying for at the pump is not a mystery, but a mosaic of global oil markets, domestic taxes, and local retail decisions.”
What to watch next
Analysts expect volatility to persist as geopolitical headlines evolve and supply forecasts adjust. If the Middle East situation stabilizes or if alternative supplies surge, the chart shows what you're paying for at the pump could shift downward in coming weeks. Conversely, a renewed disruption would likely push the wholesale price component higher again, with consumers feeling the impact quickly.
Consumers can respond by monitoring station pricing, planning trips to reduce unnecessary driving, and using loyalty programs that offer per-gallon savings. A broad trend of price declines or increases tends to begin with crude markets; the chart shows what you're paying for at the pump will often reflect those moves with a short lag.
Data snapshot
- National average price for regular gasoline: around $4 per gallon, up roughly 8-12% year over year.
- Brent crude price: near $80 per barrel, up about 12% year-to-date.
- Share of price from crude oil: roughly 60-65% on average across regions.
- Refining costs and margins: roughly 15-20% of the pump price.
- Taxes: vary widely; many states push 15-25% of the price at the pump.
- Retailer margins: typically 3-7% or a few cents per gallon, depending on competition and station format.
Bottom line
The latest chart shows what you're paying for at the pump is not a random number. It is a layered signal that blends global oil fundamentals with local economics. As geopolitical risk ebbs or flows, the components shift, and the total price follows. For now, drivers should expect the chart to keep telling the same story: crude prices and region-specific costs will continue to steer the day-to-day price you see on the street.


Discussion